SGIS v.R LiDAR Data Processing: Visualizing Point Clouds by Intensity
Published on: 01.11.2024
Intensity in LiDAR data refers to the strength of each laser pulse’s return signal when it bounces back from a surface. This strength can vary depending on the reflectivity of the object hit by the laser, which in turn depends on factors like the material’s properties and the wavelength of the laser—usually in the near-infrared range. For instance, different materials (like concrete, vegetation, or metal) reflect light differently, so their intensity values will vary.
In LiDAR processing, intensity values play an important role in identifying and categorizing features within a dataset. It’s often used to support feature detection, point classification, and sometimes even as a substitute for aerial imagery when those aren’t available. Since intensity values are relative (rather than absolute), they can change based on factors like flight height or environmental conditions. This means that the intensity recorded for the same target might differ from one flight to another.
SGIS v.R is enhancing this capability by offering tools to generate intensity-based images directly from LiDAR data. Users will be able to seamlessly switch between classification and intensity views while working, adding a new layer of detail to their analysis. This flexibility can be especially valuable, providing clearer insights into surface characteristics and improving the precision of feature detection.
What Is the Purpose of Intensity in LiDAR Processing?
Intensity values are valuable because they allow you to visualize point clouds in a way that highlights the reflective properties of different surfaces. For instance, materials like asphalt tend to show up with lower intensity (darker), while metals and vegetation often display higher intensity (brighter). This contrast makes it easier to differentiate between materials and identify vegetation, which is particularly useful in fields like urban planning and forestry.
This makes intensity data especially useful for tasks like land classification, object recognition, and enhancing digital surface models. Intensity-based images also aid in feature extraction, making it easier to classify various surfaces, such as roads, buildings, and vegetation.
This demonstration will outline how to visualize LiDAR data by intensity using SGIS technology in SGIS v.R through a couple of practical examples. First, a LAS dataset is imported using the ‘View LiDAR Boundaries’ tool. Subsequently, the ‘LiDAR’ toolbox is accessed.
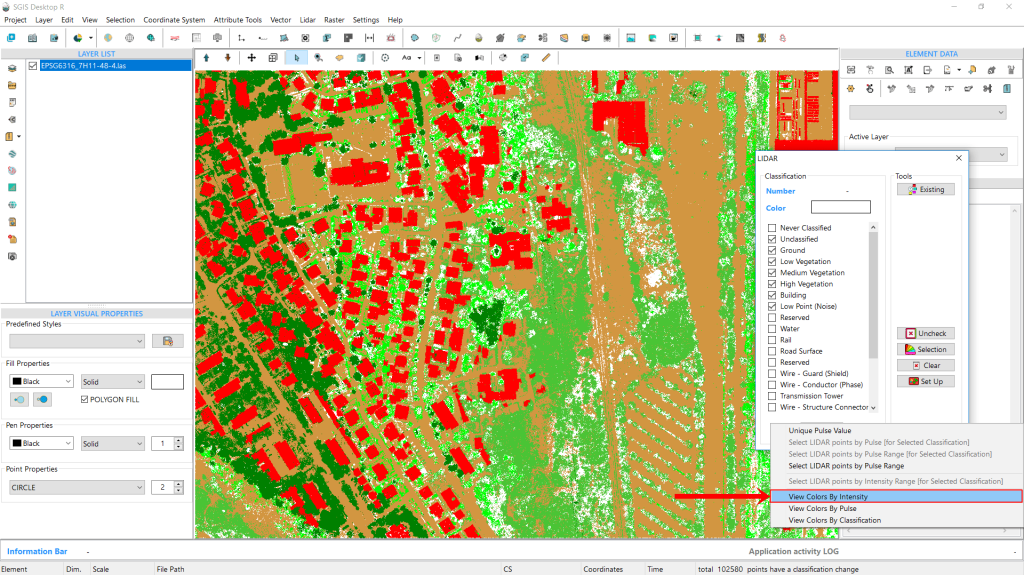
In the ‘Tools’ tab, users will find various buttons designed for managing LiDAR point cloud data, whose functions and purposes have been previously described. Therefore, we will proceed directly to this functionality. After navigating past the ‘Set Up’ button, a blank memo space appears. By right-clicking in this space, a new dropdown menu will appear. Here, users can find options for managing, selecting, and visualizing points. The data can be visualized not only by classification but also by intensity and pulse range. Additionally, users can make selections based on intensity values and pulse range. These functions will be explained in detail in another practical use case example.
As this is an ongoing development, these functions may be located in different areas of the software or may appear slightly modified in the final version. Nevertheless, our focus is on describing the technology and its valuable practical applications.
Fig. 1 Overview of the ‘Tools’ tab in SGIS v.R. The interface displays various buttons for managing LiDAR point cloud data. Users can right-click in blank space of the toolbox to access a dropdown menu containing options for managing, selecting, and visualizing points. This view allows for data visualization by classification, intensity, and pulse range, as well as the ability to make selections based on intensity values and pulse range.
In the new dialog menu, navigate to ‘View Colors by Intensity’ and select it.
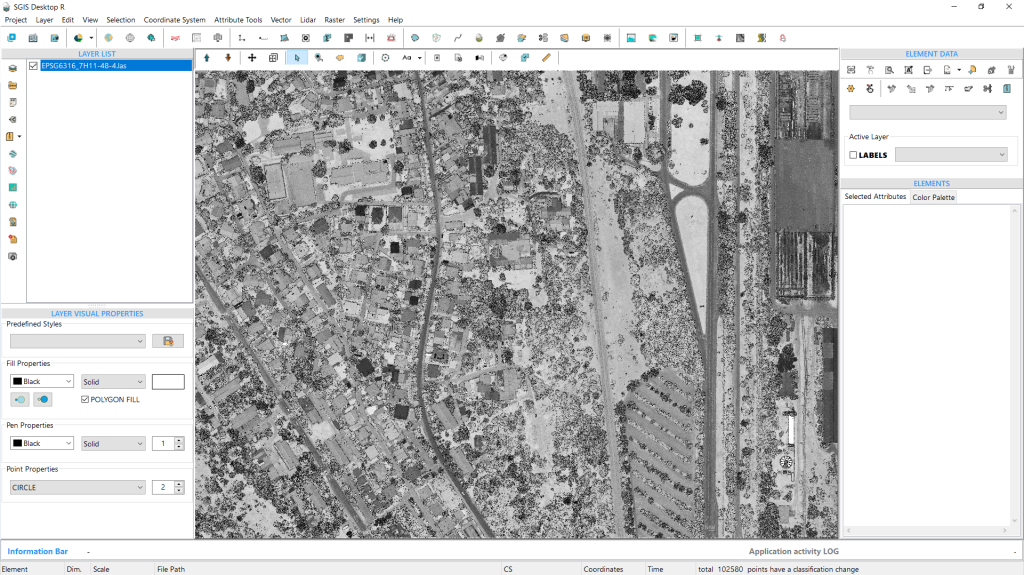
Once selected, the points will be displayed according to their intensity values. This view serves as an alternative to traditional aerial imagery datasets. When standard aerial imagery is unavailable, intensity-based LiDAR images can provide a suitable substitute. These images resemble black-and-white photographs and offer essential visual information for further processing and analysis.
Fig. 2 Visualization of points in Intensity View within a forest environment.
We will include another example from an urban setting featuring roads, buildings, vegetation, and man-made objects.
By analyzing intensity values, LiDAR data can be utilized to categorize and detect objects, as well as enhance the differentiation of surfaces, particularly concrete surfaces such as roads and various types of buildings.
Fig. 3 Example of LiDAR data visualization in an urban setting. The image features various elements, including roads, buildings, vegetation, and man-made objects. By analyzing intensity values, the LiDAR data is utilized to categorize and detect different objects while enhancing the differentiation of surfaces, particularly concrete surfaces such as roads and various types of buildings.
Fig. 4 Visualization of points in Intensity View within an urban environment.