
The digitizing feature is a fundamental capability in GIS that supports the creation, integration, and updating of spatial data, enhancing the overall functionality and utility of GIS systems.
The ability to input new features by drawing, or digitizing, is highly useful in GIS for several reasons:
- Data Creation and Integration: Digitizing allows for the creation of new spatial features from scratch, enabling the integration of various types of geographic data into the GIS system.
- Customization: Users can create custom features that meet specific project needs.
- Accuracy and Precision: Digitizing tools often come with snapping and other precision features that help ensure the new features are accurately placed in relation to existing spatial data.
- Updating Layers: As new geographic information becomes available, digitizing allows users to add new features and update existing layers, keeping the GIS data current and relevant.
To illustrate the process of drawing a line feature representing a road in SGIS v.R, let’s walk through the steps involved. This example will demonstrate how to start digitizing a new road feature, ensuring that it accurately represents the intended geographic entity.
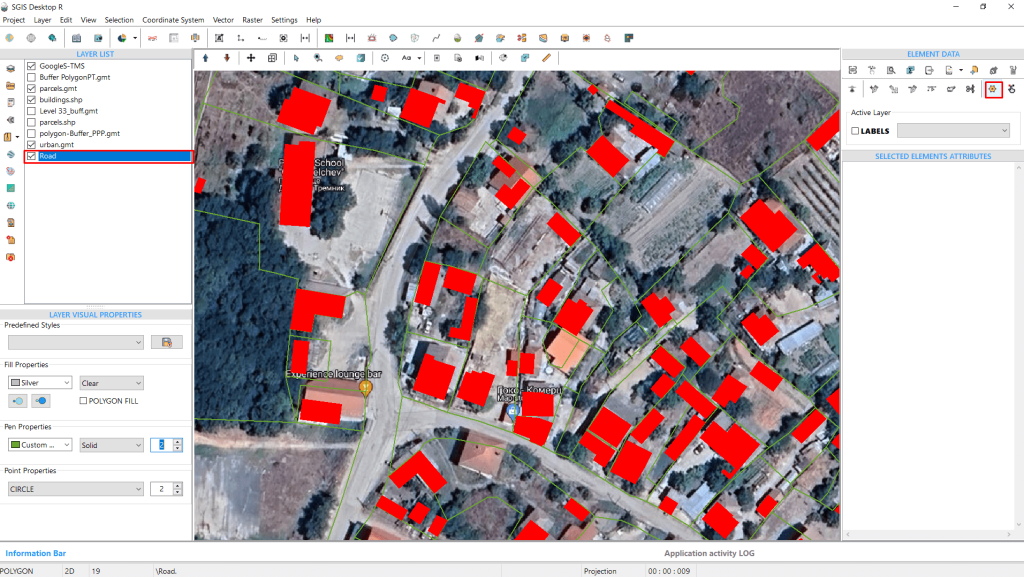
The user needs to create a new polyline layer. SGIS allows users to choose the type of layer they want to create, whether it consists of points, polylines, or polygons. Once the new blank layer is created, it will appear in the Layers panel.
Next, the user should click on the ‘Pick Points’ function. This multipurpose tool, as described in the User Guide, can be used for drawing in this context. The tool is activated upon clicking.
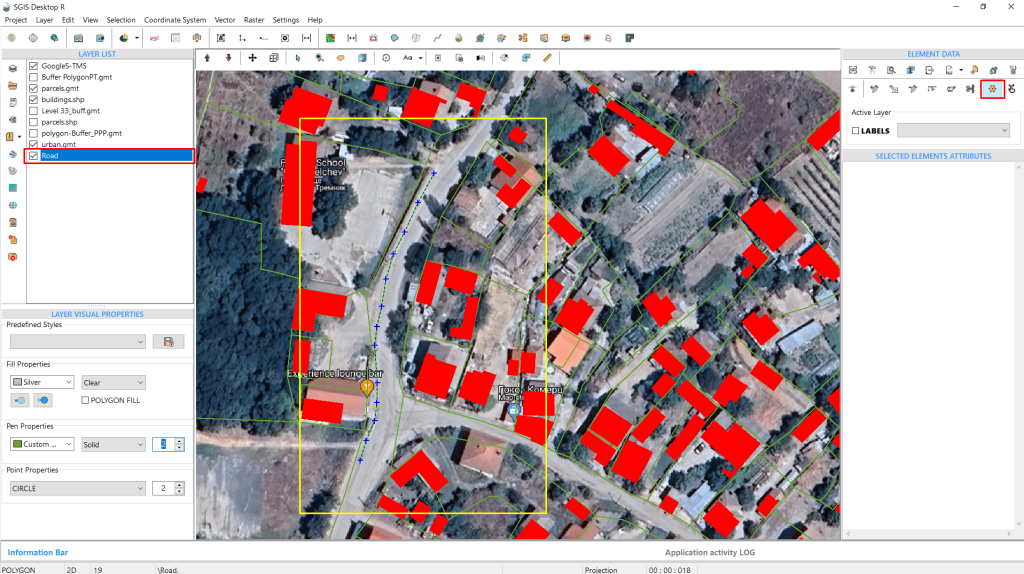
Fig.2 A vector polyline is drawn using the multipurpose ‘Pick Points’ tool.
After drawing the polyline by clicking on the graphics panel, the user needs to select the ‘Create Element’ tool.
This tool assigns the drawn line to the active layer as a new feature. It offers the option to create the new element as a geometrical feature only, as an element with attributes, or by inheriting attributes from a previously added and opened layer.
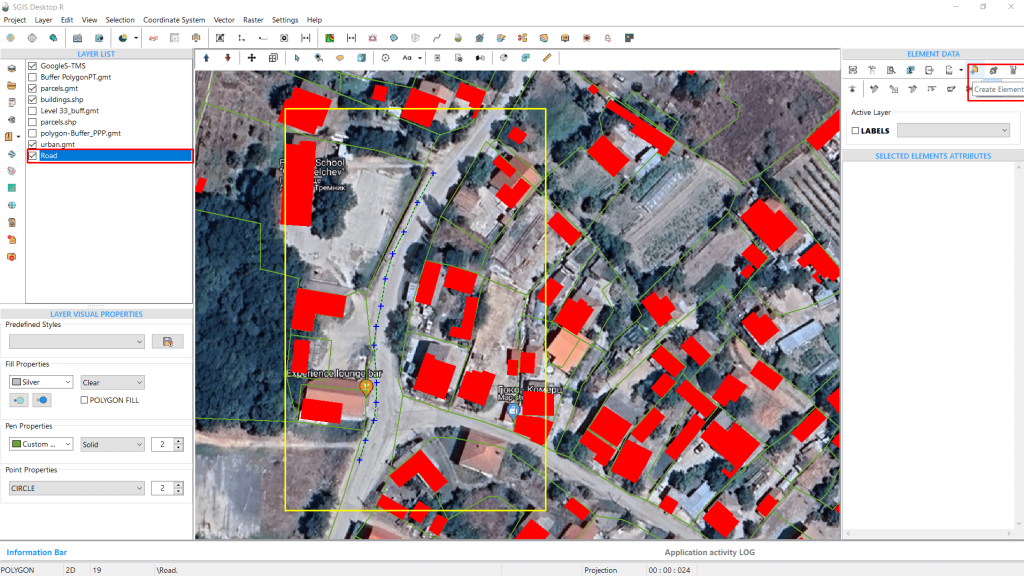
Fig.3 The drawn polyline is assigned to the newly created layer using the ‘Create Element’ tool.
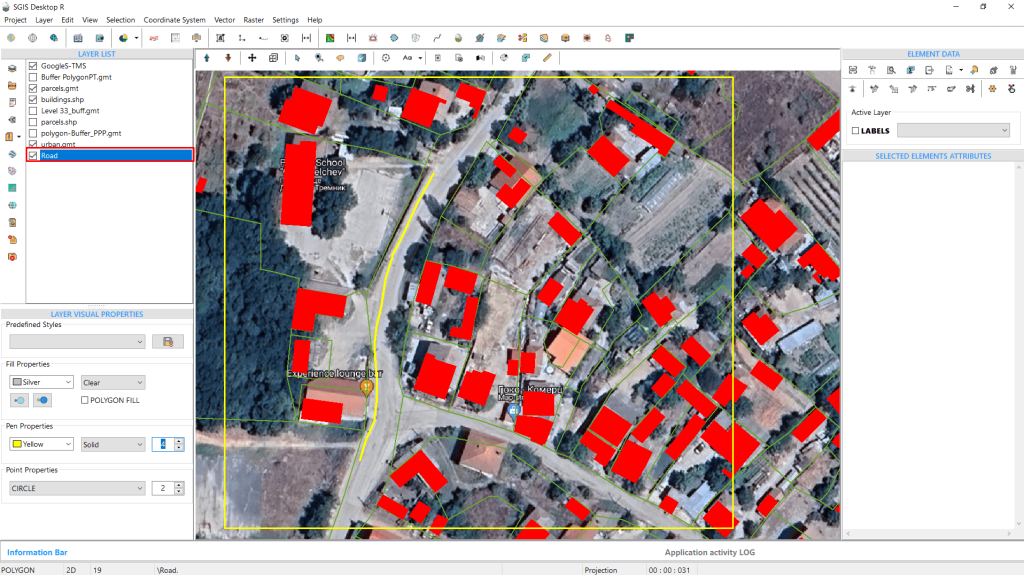
Fig.4 The polyline feature has been assigned to the desired layer.
The auto-drawing polygon feature by picking vertices on the graphics panel significantly enhances GIS functionality by making it easier, faster, and more accurate to create polygonal spatial features.
This function streamlines the process of creating complex polygons, allowing users to quickly define shapes by simply clicking on key points. This reduces the time and effort required to draw each segment manually. By placing vertices directly on the graphics panel, users can ensure that the polygon accurately represents the intended area.
Additionally, this method is intuitive and easy to learn, making it accessible even for users with limited GIS experience.
In this example, we’ll demonstrate how to use the auto-drawing polygon feature with a specific dataset.
Using an OpenStreetMap background, we need to export vector outlines of buildings. We will start by tracing one building as an example.
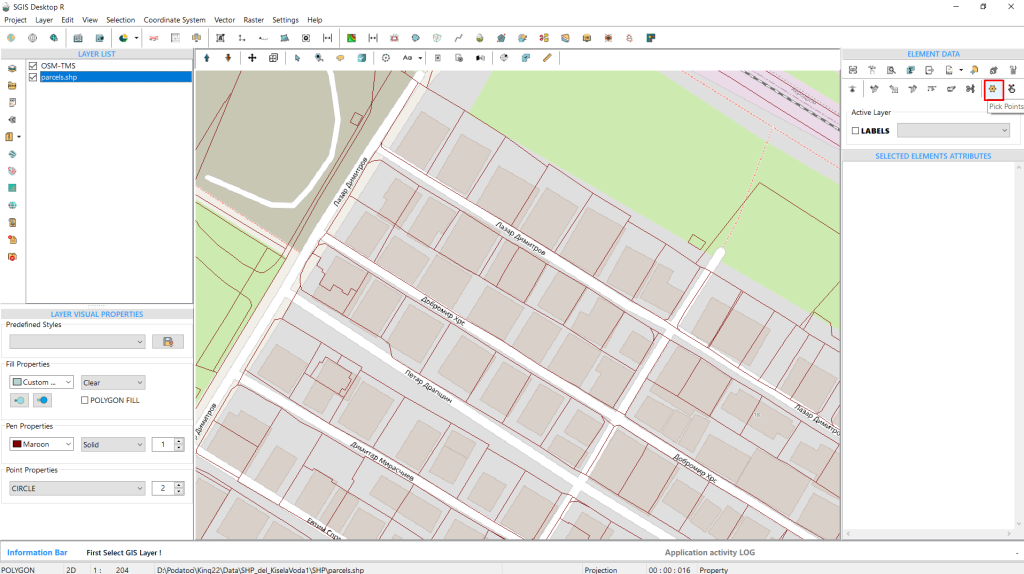
First, create a new polygon layer to contain the building features:
- Click on ‘Create New Layer’ and select ‘Polygon’. SGIS allows users to choose whether their new layer will consist of point features, polylines, or polygons. We need to choose polygons.
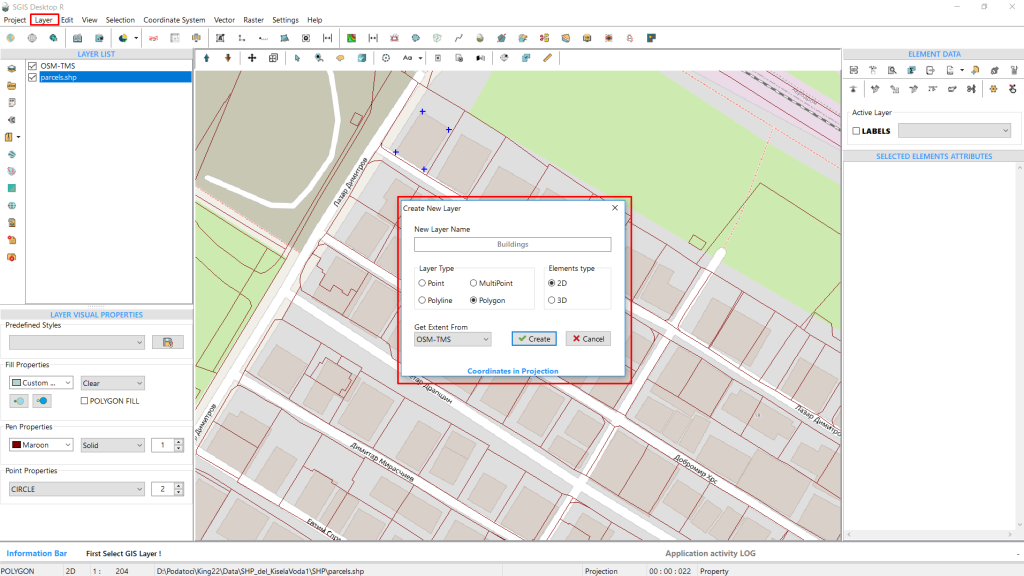
Fig.6 Creating a new building layer to contain the newly formed building polygons.
- After creating the new Buildings layer, click on the multipurpose ‘Pick Points’ function.
With this function activated, start clicking on the graphics panel to place vertices.
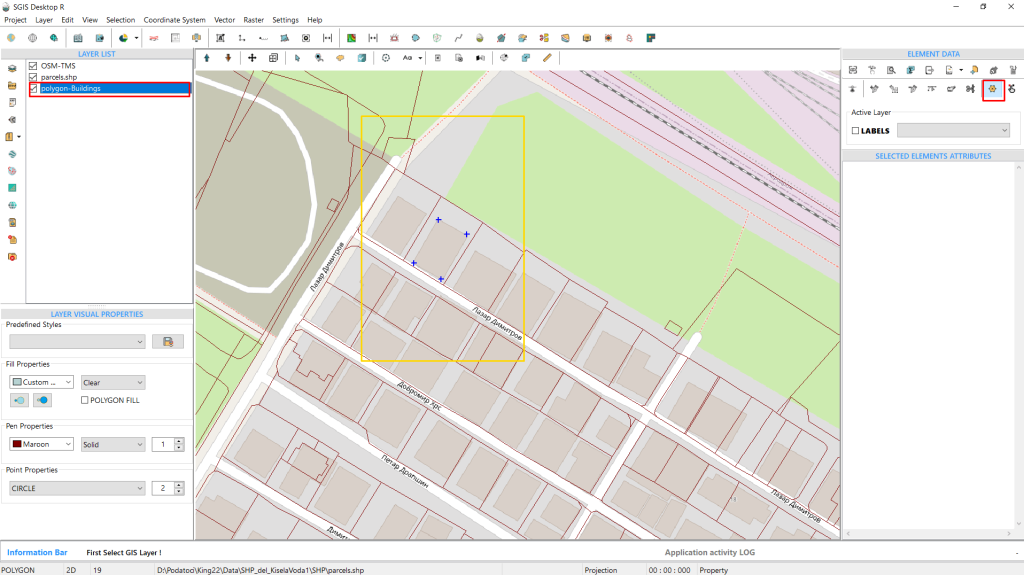
Fig.7 With the newly created layer checked in the Layers panel, we activate the Pick Points function to place placemarks where we want the building to be outlined. In our example, this area is highlighted with a yellow rectangle.
For this example, we’ll place four visible placemarks to outline the building.
Finally, assign this outline as a polygon feature in the new layer by clicking on the ‘Create Element’ function. This action will complete the creation of the building feature.
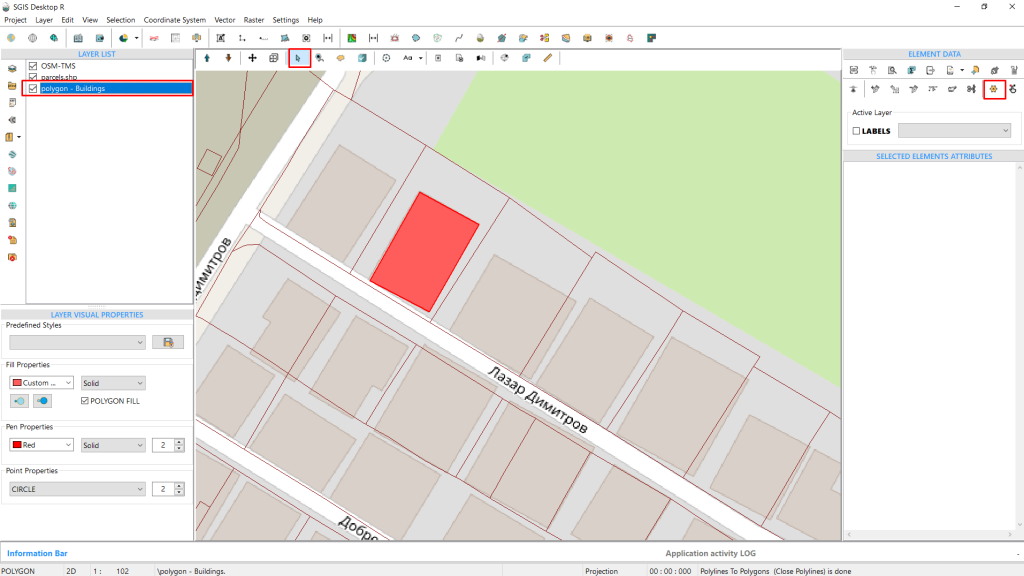
Fig.8 The building polygon has been created.
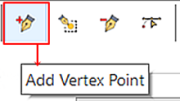
The ‘Add Vertex’ tool allows users to modify their existing features with ease. Whether editing an existing layer or creating a new one within a specified extent, activating this tool is straightforward. The user simply selects the existing feature—in our example, a polyline representing a road that needs to be extended by adding extra vertices. This mirrors many real-world scenarios, especially those involving fieldwork that spans multiple days of data collection and subsequent data importation.
Drafting engineers often need to edit vertices or make modifications to lines, making this function extremely useful. Below is a practical example demonstrating how this tool works with real data in the SGIS v.R environment.
The editing functions in SGIS are only accessible after the user selects the desired feature. This requires the ‘Selection’ tool to be active, along with the ‘Vertex’ function.
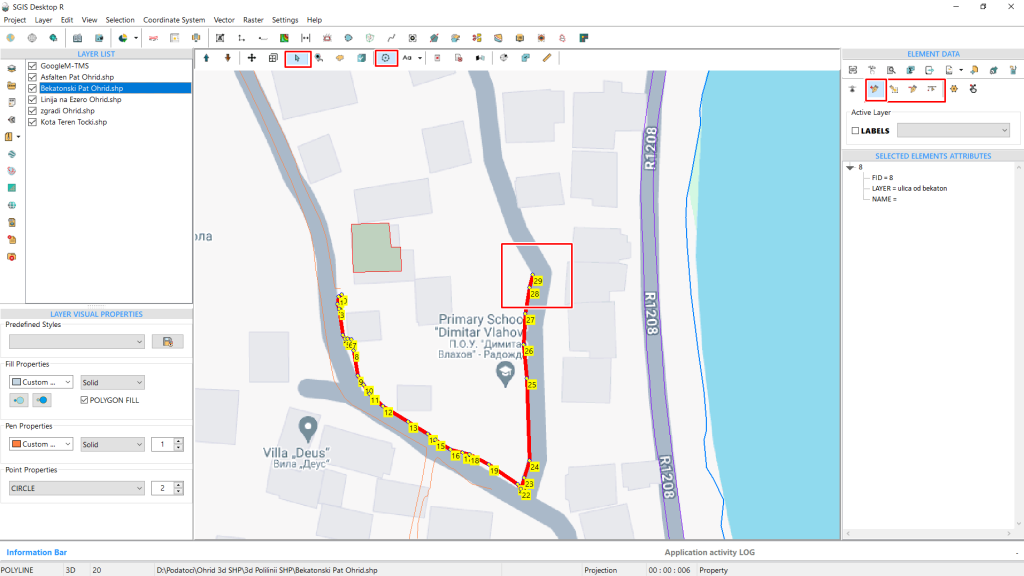
To extend the line, begin by clicking on the graphics panel. By holding the Shift key [Shift+Left Click], the snapping function is activated, enabling precise connection to the last vertex of the existing polyline.
As you add vertices, they will be numbered sequentially, providing a clear and precise overview.
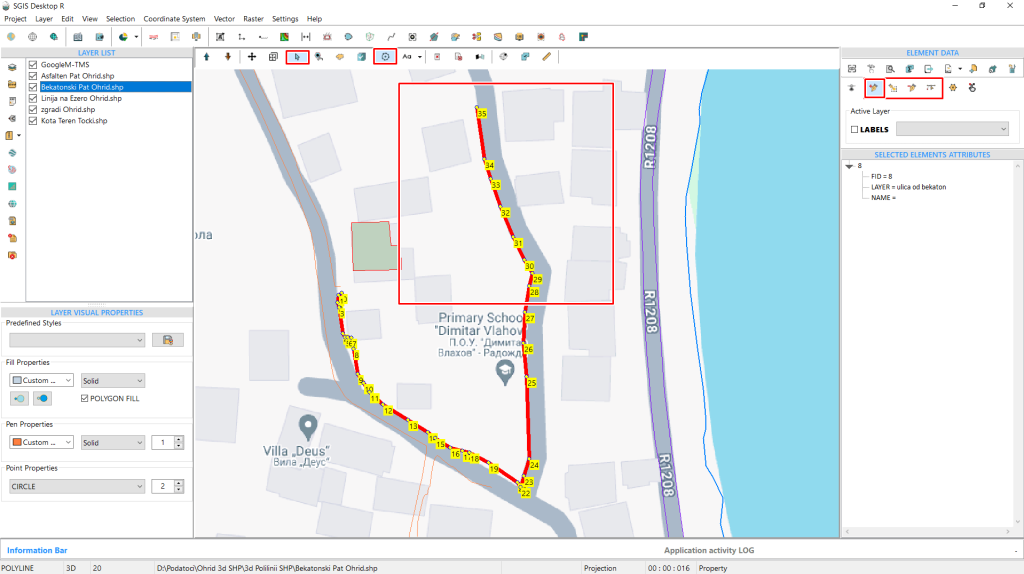
Fig.10 Additional vertices are added, extending the polyline.
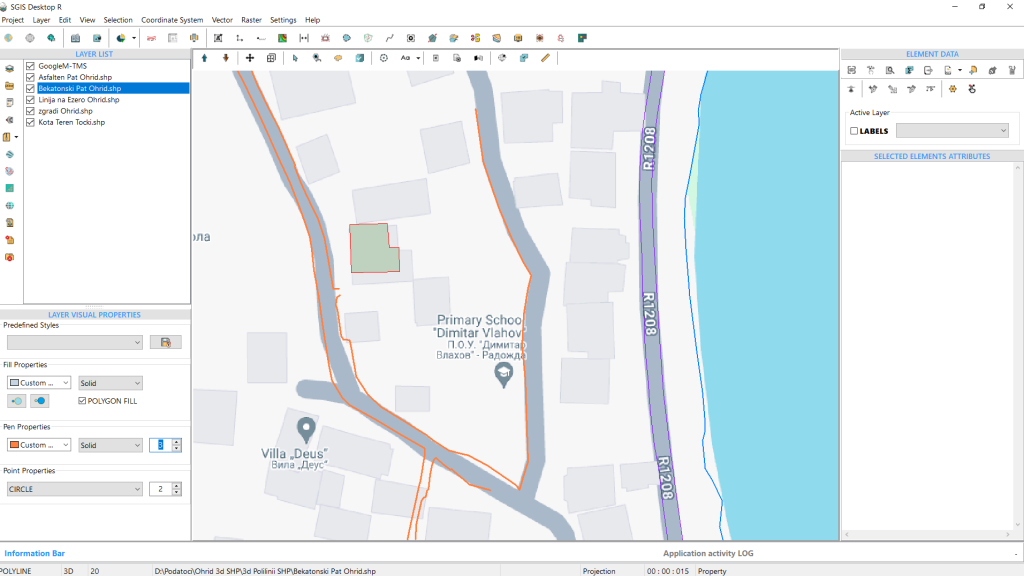
Fig.11 The procedure is completed, and the action buttons are deselected.
Once the desired number of vertices has been added and the user has finished editing, the ‘Add Vertex’ button should be deselected to complete the procedure.
If the ‘Add Vertex’ tool remains active, clicking on the ‘Vertex’ function or ‘Deselect All’ will automatically conclude the process.
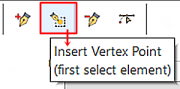
The ‘Insert Vertex’ tool is highly useful in GIS for making precise modifications to the geometry of spatial features. It comes in handy in several common scenarios, such as when the shape of a feature needs to be refined or adjusted for greater accuracy. By adding additional points, users can better match the feature to the actual geographic entity.
This tool is also valuable for updating geographic data. As new information becomes available, features may need to be updated to reflect real-world changes. The ‘Insert Vertex’ tool allows users to incorporate these updates without having to redraw the entire feature.
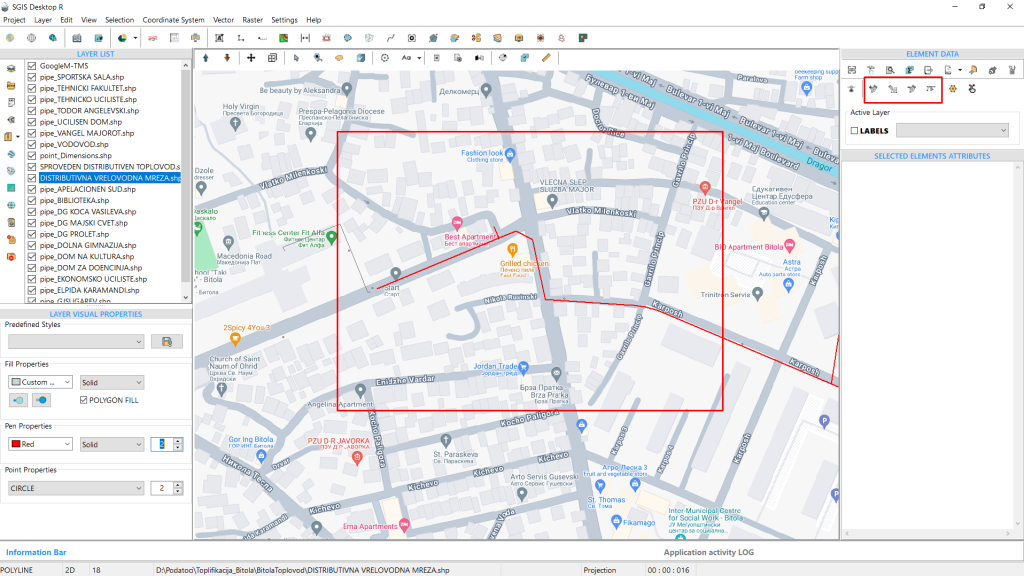
In our example, we have a polyline feature representing a heating network pipeline. The segment we want to modify with the ‘Insert Vertex’ tool is highlighted with a red square.
To begin editing, the tool must be activated. Start by clicking ‘Select,’ then ‘Vertex,’ and finally selecting the ‘Insert Vertex’ icon from the toolbox. This allows us to click on the line feature where we want to insert the vertices.
The ‘Selection’ highlights the desired line feature, while the ‘Vertex’ tool assigns numbers in the order they are clicked.
This ensures that when we insert new vertices, we will know their sequence in the drawing order.
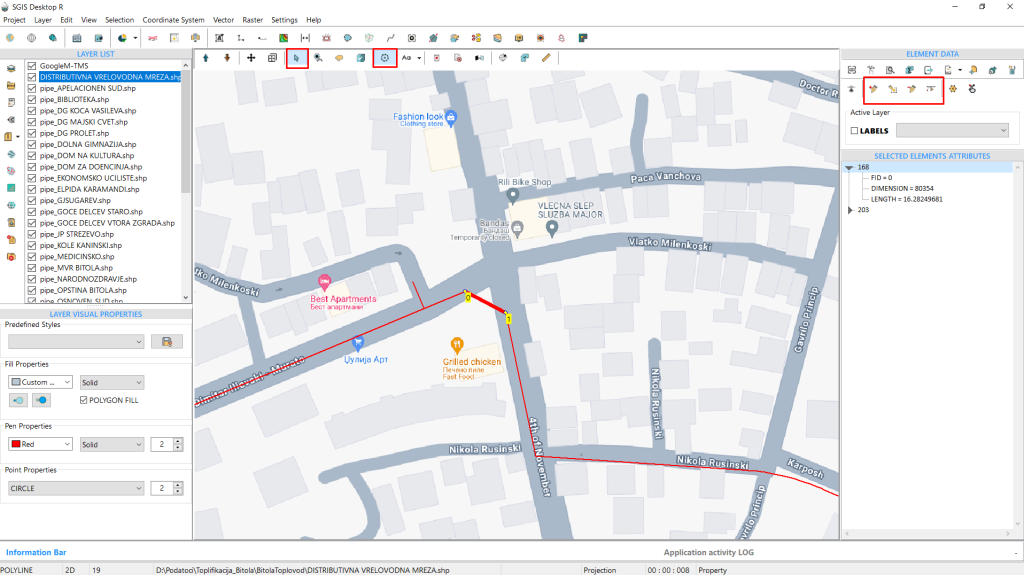
Fig.13 The desired line segment is selected and highlighted.
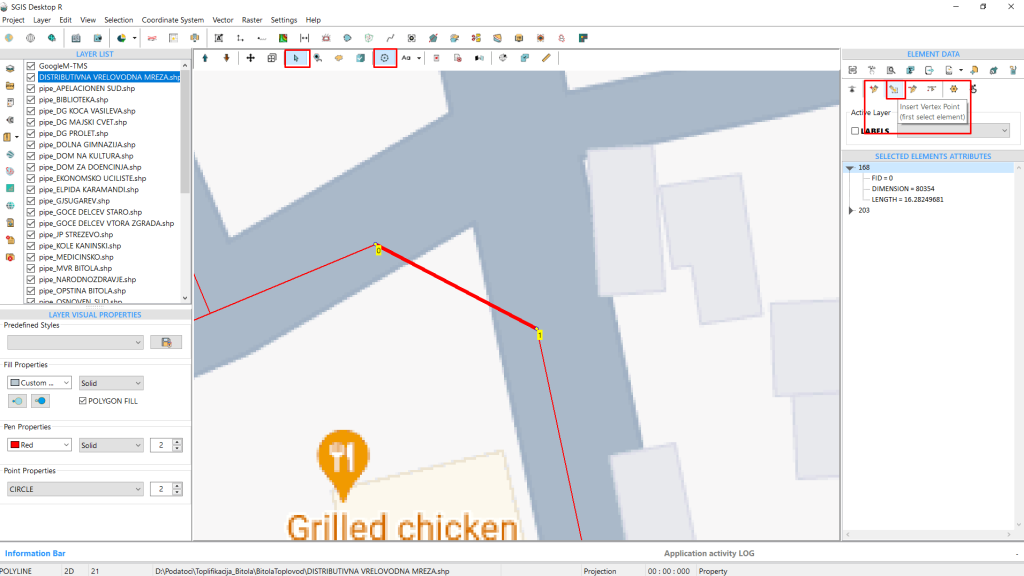
Fig.14 The view is zoomed in for better visual clarity, and the ‘Insert Vertex’ tool is activated to allow the insertion of vertices wherever needed on the feature.
We zoom in for better visual clarity, then click on the ‘Insert Vertex’ tool to activate it. Once activated, we can insert vertices wherever needed on the feature.
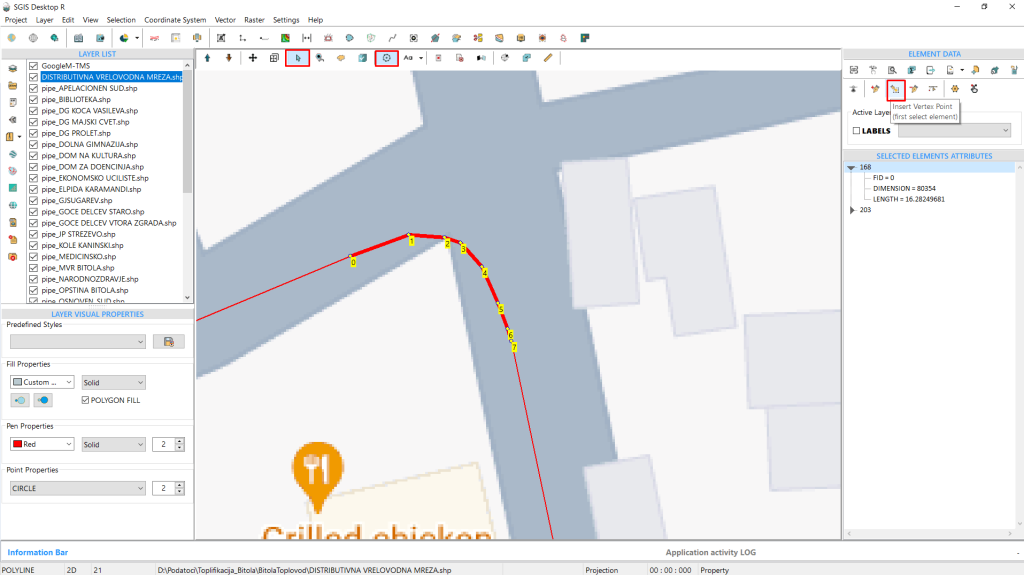
Fig.15 Vertices have been inserted, and the line has been modified accordingly.
The ability to reshape features by modifying vertices directly on the graphics panel greatly enhances the accuracy, flexibility, and usability of GIS data.
This function enables users to make precise adjustments to the shape and position of spatial features, ensuring the data accurately reflects real-world objects and boundaries. By allowing for detailed modifications, it helps maintain the integrity and accuracy of geospatial information.
Additionally, accurate reshaping of features improves the visual representation of spatial data, making maps and models more reliable and informative. Users can easily adjust existing features without needing to redraw them entirely, saving both time and effort.
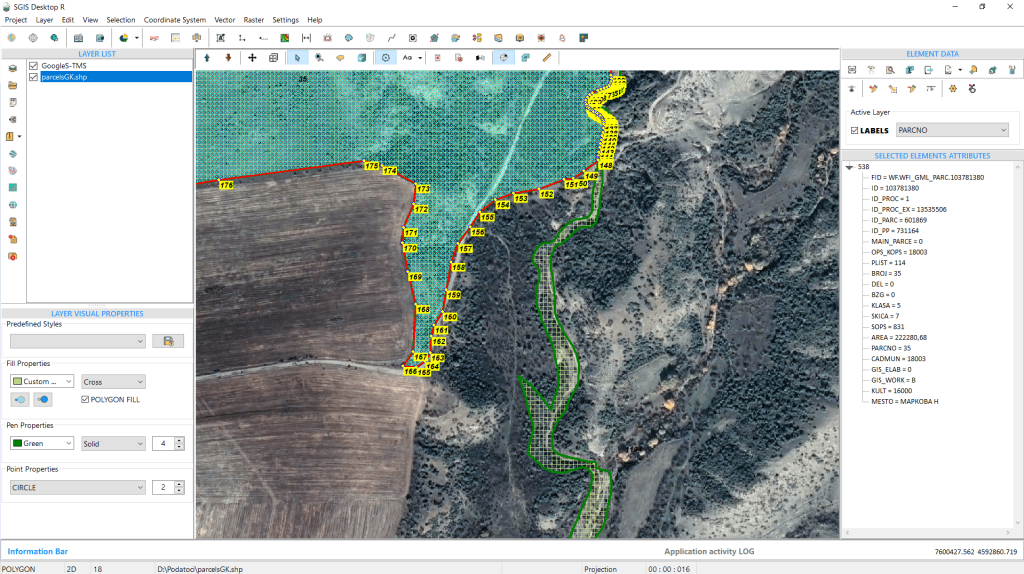
In this example, we’ll demonstrate how to modify the vertices of a cadastral data representing a larger land parcel. Several vertices need to be moved and snapped to new vertex points.
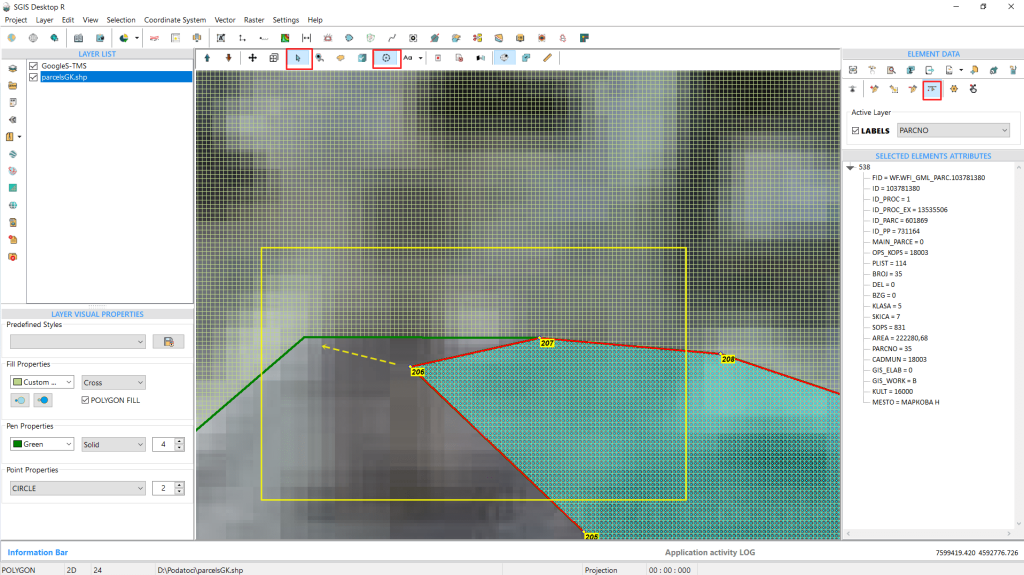
Fig.17 Identifying the area and vertex that need to be modified. The vertex numbered 206, as shown in the picture, needs to be repositioned.
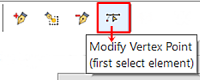
First, activate the ‘Selection’ and ‘Vertex’ functions. Then, from the SGIS editing toolbox, select the ‘Modify Vertex’ function.
Once active, click on the vertex you want to modify. The process is illustrated in the images below.
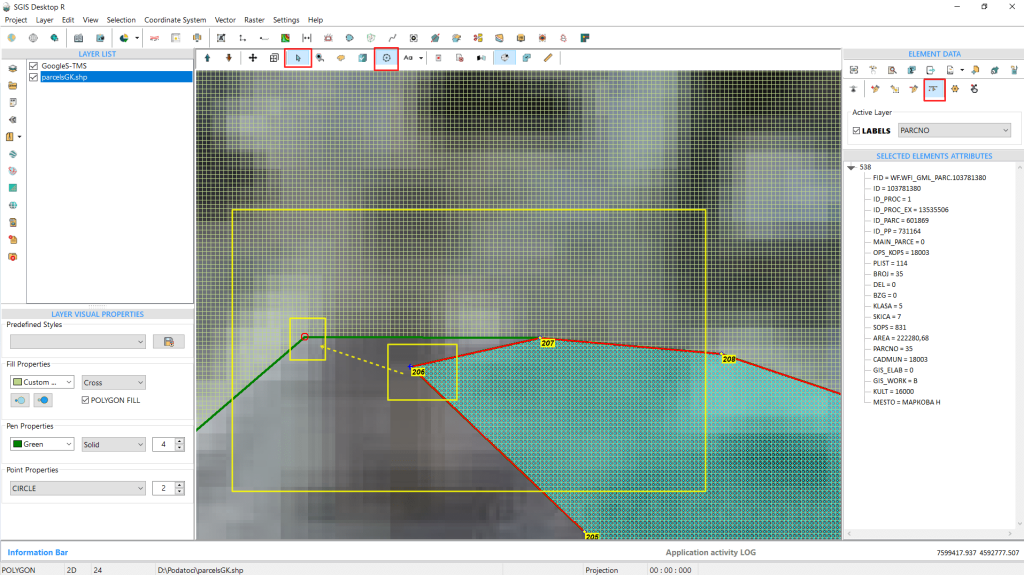
Fig.18 Left-click on the vertex to be repositioned. A blue cross appears to visually highlight the point. Holding the Shift button activates the snap circle, ensuring greater precision.
After selecting the desired vertex with a left mouse click, click on the vertex where you want to reposition the point. To ensure precision, hold the Shift button, which activates the snapping function. This is visually indicated by a red circle around the point location in the graphics panel.
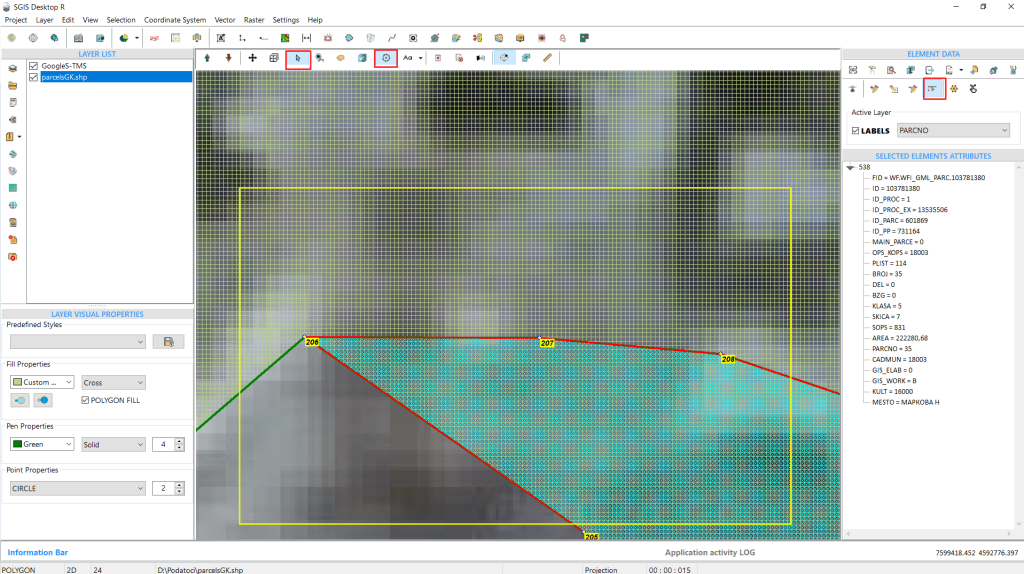
Fig.19 Vertex point 206 repositioned, action completed.
Click on the circle to complete the vertex modification.
Directly inputting coordinates ensures that vertices are precisely placed, enhancing the accuracy of spatial data. For complex geometries or densely packed features, modifying vertices through coordinate input can be more manageable than making manual adjustments on the graphics panel.
This tool offers an extra layer of functionality for users who need exact control over their geospatial data, particularly in professional fields such as cadastral mapping, urban planning, and engineering.
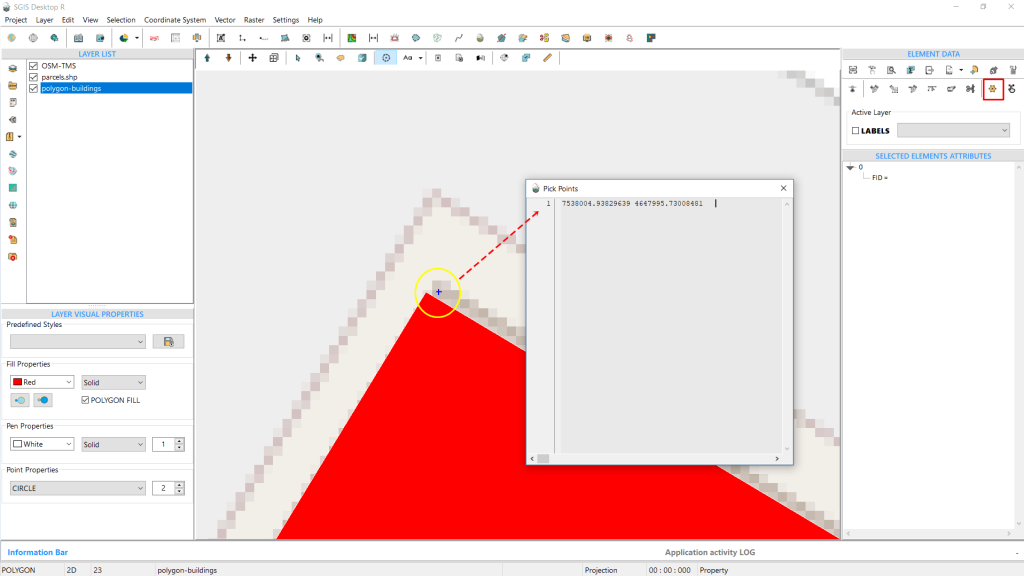
In this task, we aim to edit the coordinates or reposition a building. Users may obtain these coordinates from various sources, such as GPS field surveys or other project-specific data. This process is straightforward with SGIS technology, which allows users to copy and replace existing coordinates easily. Additionally, SGIS enables users to select coordinates directly from a map or GIS layer.
In our example, we’ve identified the area we want to edit and placed a placemark using the ‘Pick Point’ function. This placemark, highlighted in blue, marks the exact location from which we will retrieve the coordinate.
To obtain the coordinate, we simply click on the ‘Pick Point’ function again, which brings up a memo notepad window displaying the coordinate. Users can copy the coordinate to the clipboard with CTRL+C.
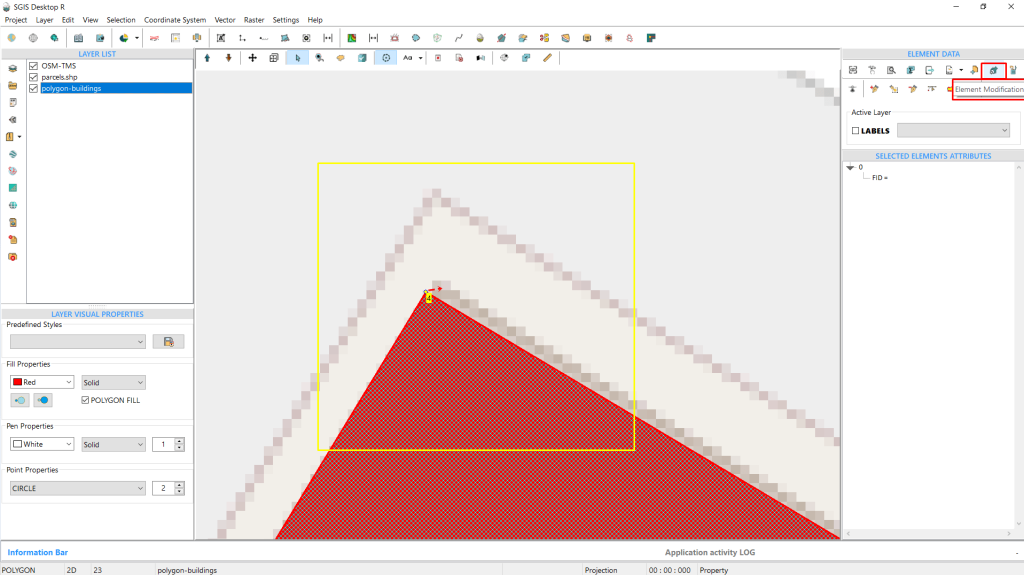
Fig.21 Vertex number 4 will be moved to the location indicated by the red arrow by updating its coordinate with the new one.
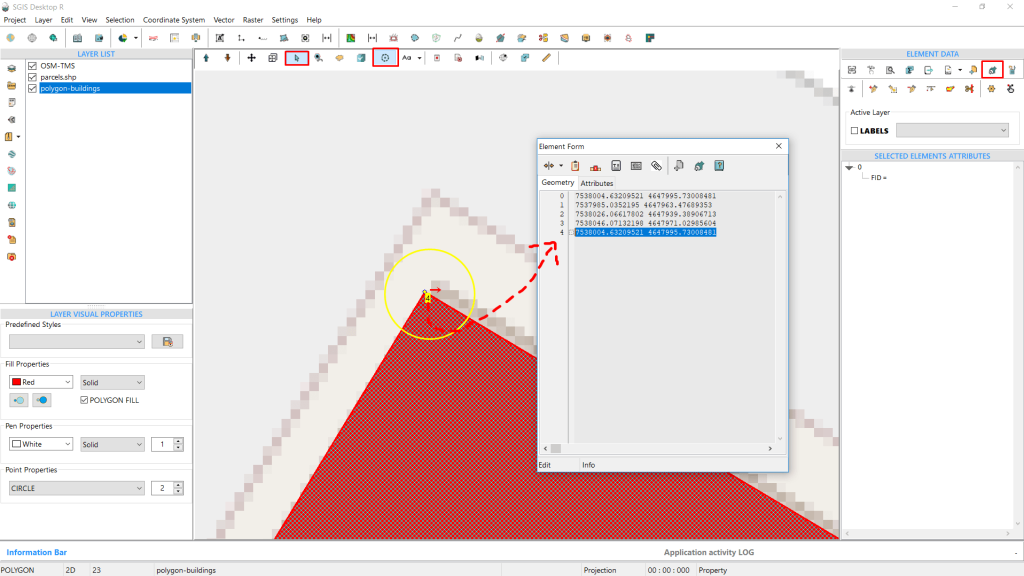
Fig.22 The coordinate notepad window is open, allowing us to modify the desired vertices directly from here.
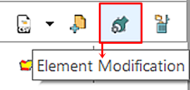
Next, we select the feature, activate the ‘Vertex’ function, and open the ‘Modify Element’ tool. This tool acts as an in-built notepad where users can change coordinates directly.
In our case, we locate vertex number 4 and paste the previously copied coordinate into the corresponding line.
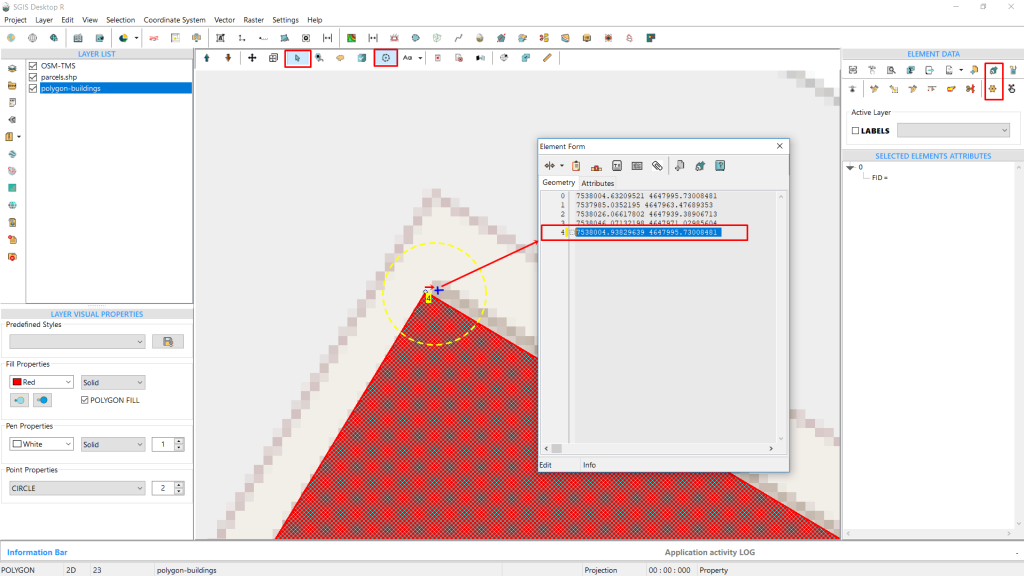
Fig.23 The retrieved coordinate, visually marked with a blue cross placemark, is copied into the notepad editor. By clicking the ‘Modify’ button, vertex number 4 will be repositioned accordingly.
By clicking ‘Modify,’ the procedure is complete.
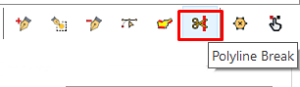
The ‘Break Polyline’ tool enables users to divide polylines at specific points, simplifying the precise editing and management of line features. By segmenting a polyline into multiple parts, users can assign distinct attributes or properties to each segment, improving the granularity and accuracy of the data.
This tool is crucial in fields like transportation, utilities, or hydrology for creating and managing complex network systems. It helps define intersections, branches, and changes in network properties.
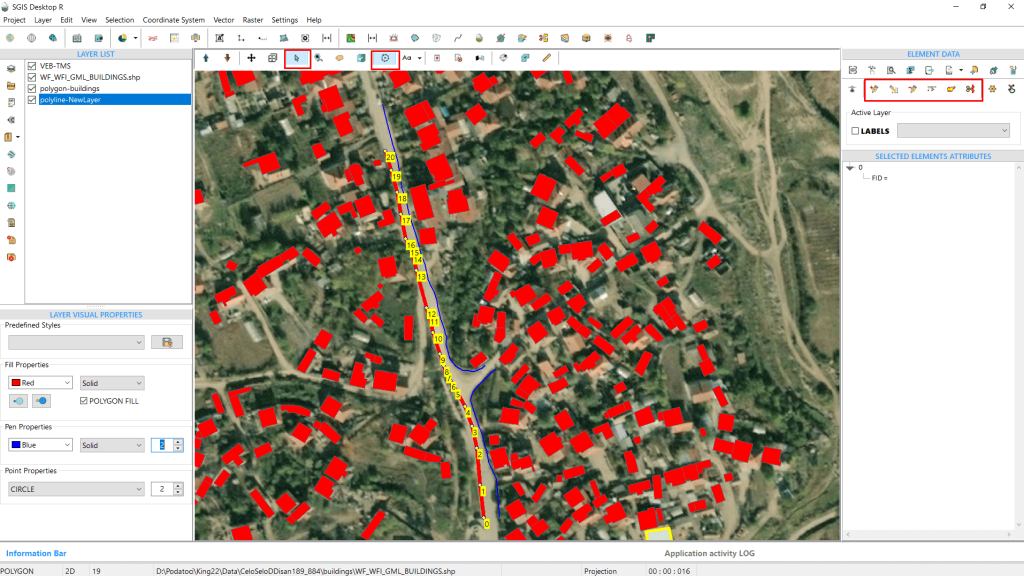
In this example, we have a polyline feature in SGIS v.R representing a road. The road has been precisely measured in the field and intersects with another road at vertex number 12. We need to cut the polyline at vertex 12 to draw another road and merge the two roads into a single logical feature consisting of multiple polylines.
To achieve this, we first activate the Selection and Vertex functions and select the polyline feature, which is highlighted in the images below with yellow vertices.
Next, we go to the SGIS editing toolbox and click on the ‘Break Polyline’ button. We locate vertex number 12 on the graphics panel and click on it.
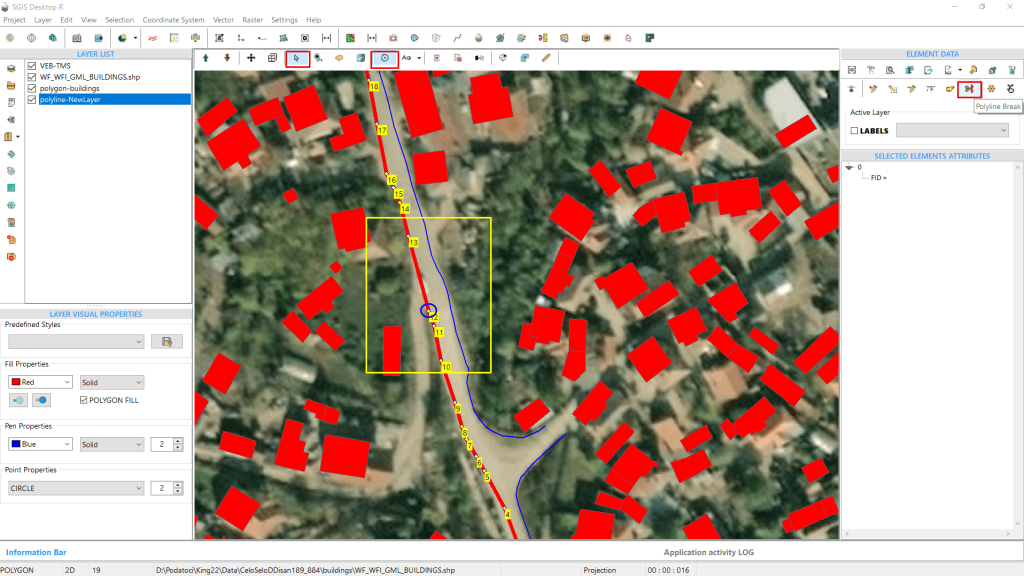
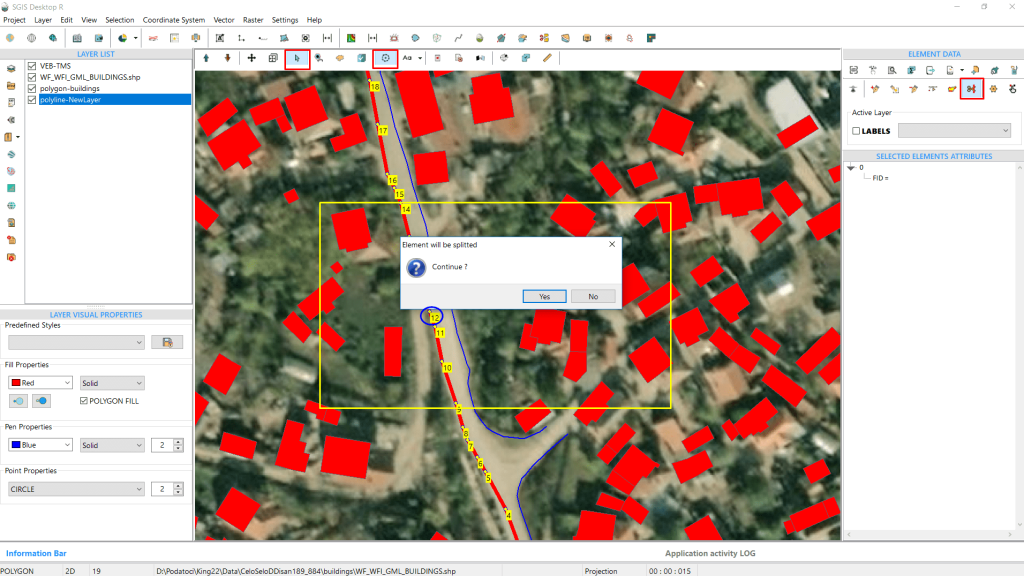
Fig.26 The process prompts the user for confirmation before executing the command, helping to prevent unwanted errors.
The tool prompts us with a confirmation message, asking if we want to split the line. If the wrong vertex is selected, we can cancel the procedure. Since we’ve confirmed the correct vertex, we click ‘Yes.’
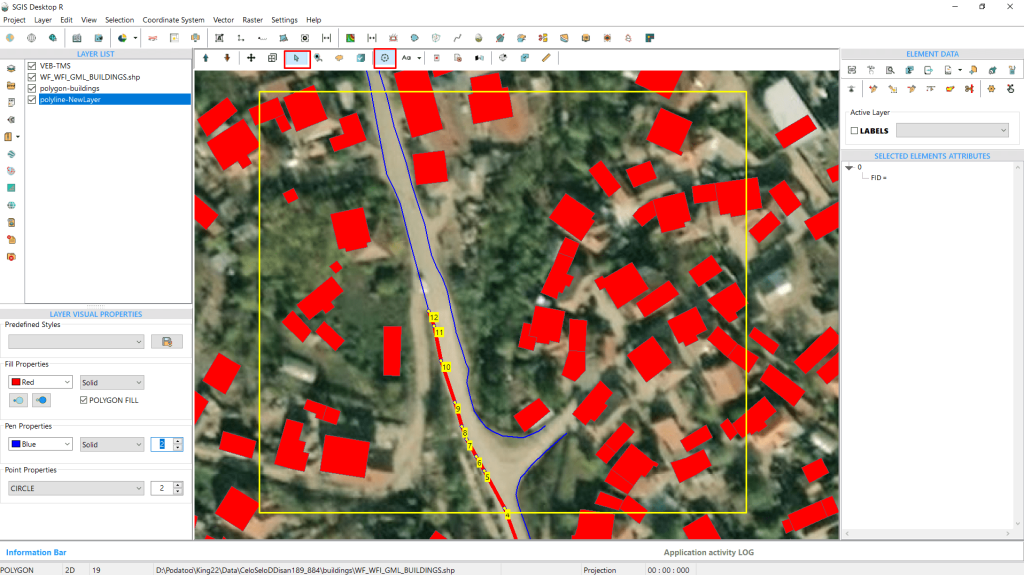
Fig.27 The procedure is complete, and the polyline feature is now divided into two segments.
The procedure is completed, and the polyline is now split into two segments. We select the polyline to verify the split, and indeed, one polyline is now two separate polylines.
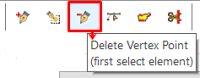
Deleting unnecessary or incorrect vertices refines the shape of spatial features, ensuring they accurately represent real-world objects or boundaries. Sometimes, vertices are placed incorrectly during data digitization or import processes. The delete vertex tool allows users to easily correct these errors.
Additionally, removing excess vertices simplifies complex geometries, which can improve data performance and readability, especially for large datasets.
To better illustrate the functionality, we’ll continue with the example from the previous task where we split a polyline feature into two segments.
This polyline represents a road that needs to be merged with an additional dataset of a connecting road. Before importing the precise field data, the easiest way to do this is to either modify vertex number 0 or delete it. Then, when the secondary road data is imported and processed, it can be connected to the main village road.
To demonstrate this, we will use the ‘Delete Vertex’ tool.
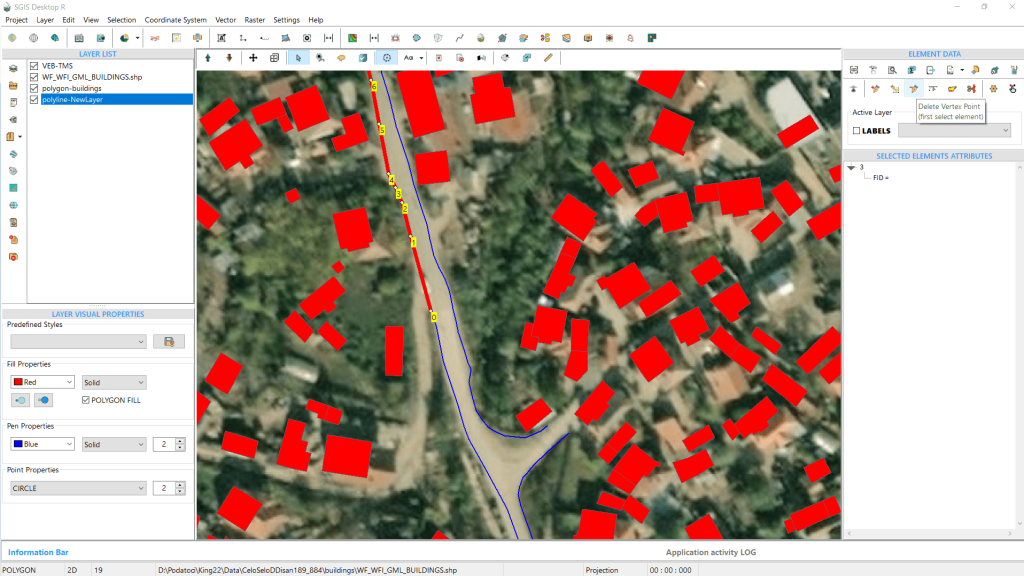
The procedure is similar to the previous tasks. First, we activate the ‘Select’ and ‘Vertex’ functions and select the polyline.
Next, we click on the ‘Delete Vertex’ tool from the Editing Toolbox. Then, we click on the vertex itself.
The software will prompt us to confirm the deletion. This safeguard prevents accidental deletions.
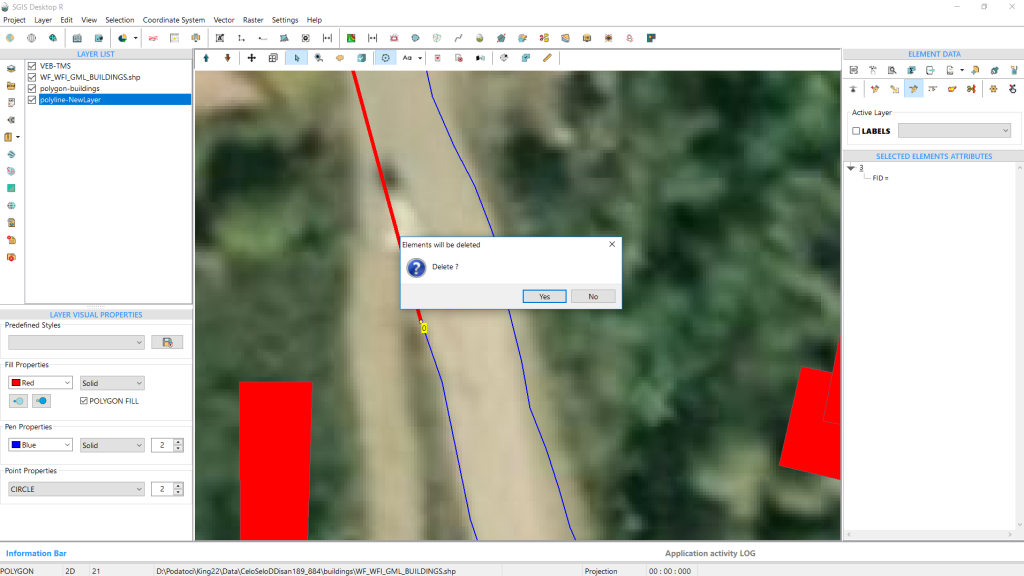
Fig.29 Upon clicking on the desired vertex, the software prompts for confirmation to ensure that the correct vertex is being deleted.
Since we are sure we want to delete the vertex, we click on ‘Yes’. The vertex is deleted automatically, and the polyline is shortened, as shown in the image below.
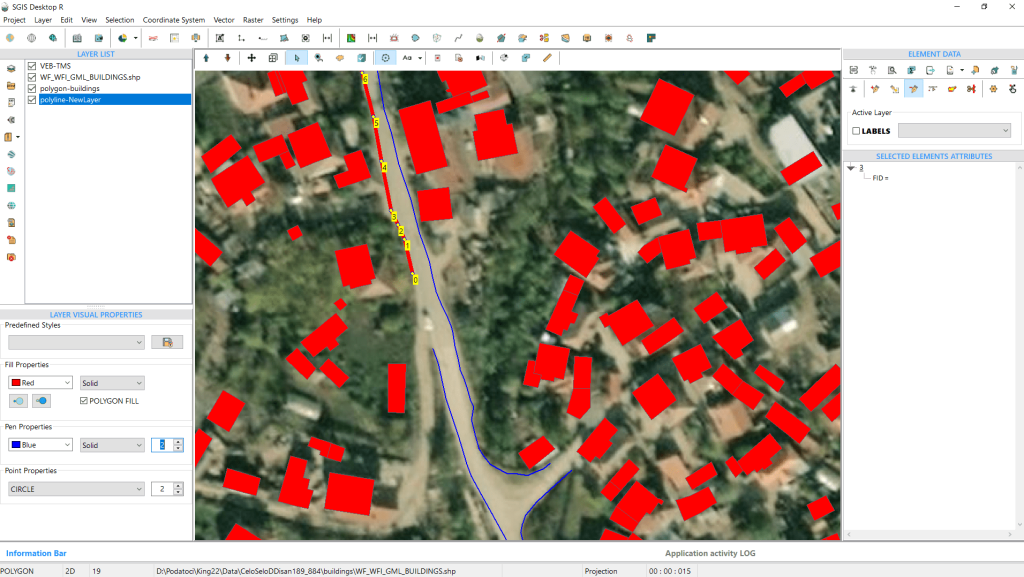
Fig.30 The editing process is complete.
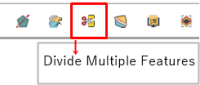
This tool is especially useful for large-scale projects, where multiple features need to be divided at common boundaries or intersections. By allowing users to edit multiple features simultaneously, it greatly reduces the time needed for manual, individual adjustments. This ensures uniform modifications across all affected features, maintaining consistency and accuracy within the dataset.
To demonstrate how this tool operates, we will open a dataset consisting of several layers, including one representing urban parcels. We’ll select three parcels using the ‘Add to Selection’ tool, with the ‘Vertex’ tool also active to display the vertices and their numbers.
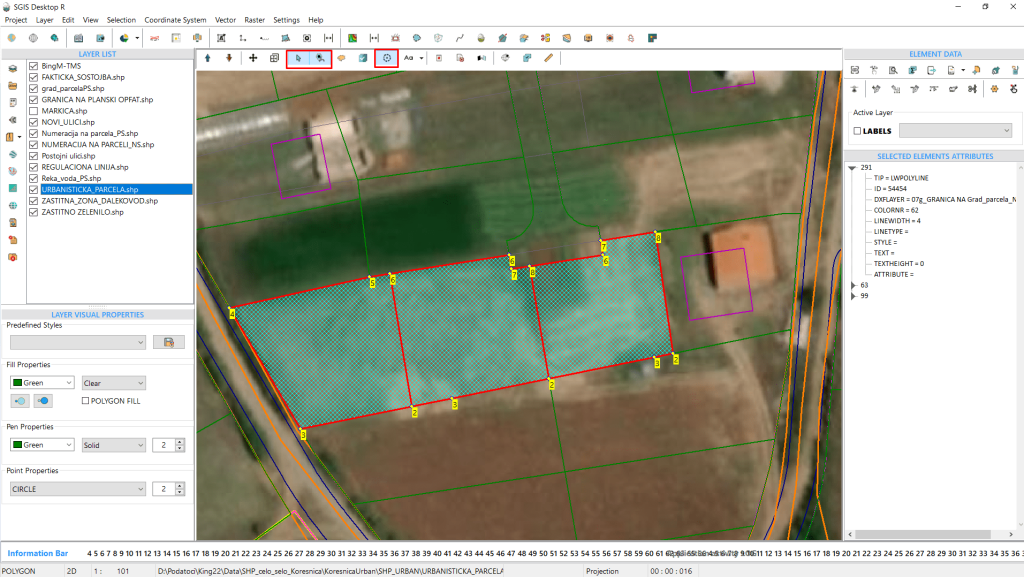
Next, we create a new layer to draw a polyline that will divide all three parcels into halves, resulting in a total of six urban parcels. Instead of splitting each parcel individually, this polyline will serve as a cutting line for all three parcels simultaneously.
Although we use three parcels in this example, this method can be applied to any number of parcels.
From the ‘Create New Layer’ dialog window, we choose polyline, name the layer ‘Division Line,’ and click OK.
The new layer is automatically created and visible in the Layers panel. The layer name can be changed later using the Rename function, accessible by right-clicking the layer.
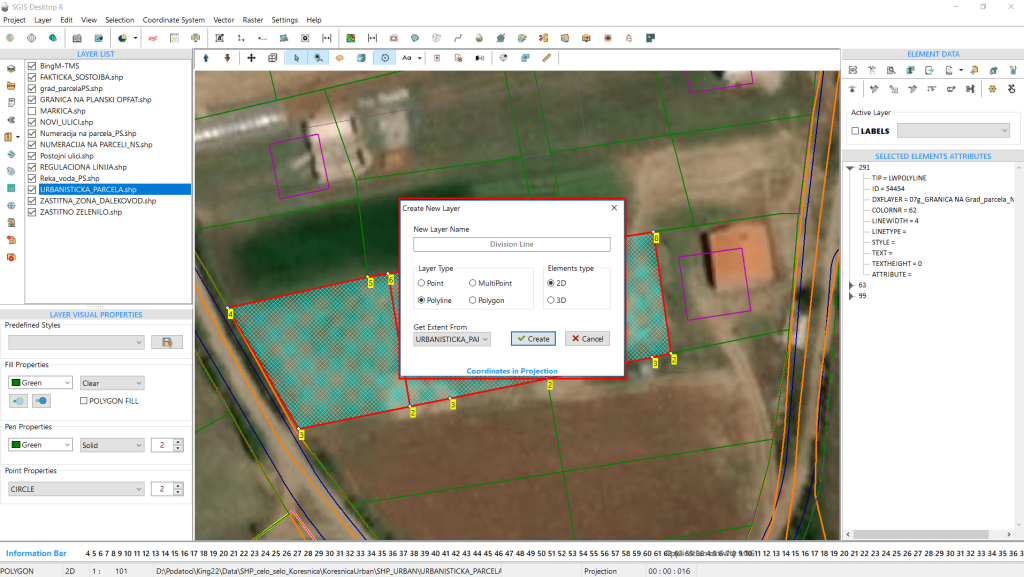
Fig. 32 A new polyline layer is created to facilitate the execution of the function.
We then activate the multipurpose ‘Pick Points’ tool to draw a polyline. By clicking on multiple desired locations on the graphics panel and using the ‘Create Element’ function, we assign the feature to the newly created polyline layer.
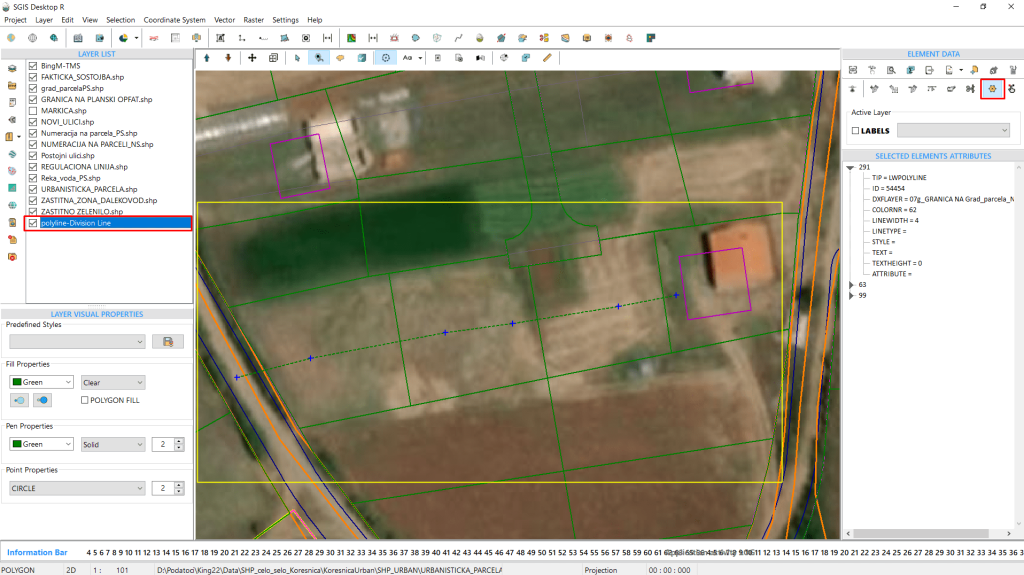
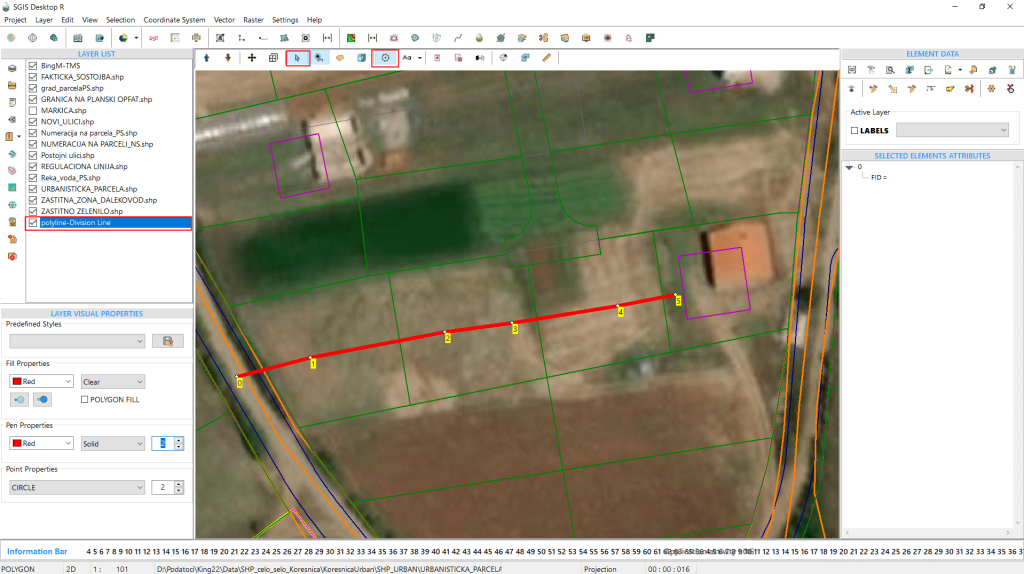
Fig. 34 The created polyline is highlighted for visibility.
Next, we click on the ‘Divide Parcels’ function, which opens a new form where we select the layer to be divided and the layer that will act as the condition layer for the division process from a dropdown list.
After selecting our layers, we simply click ‘Divide.’
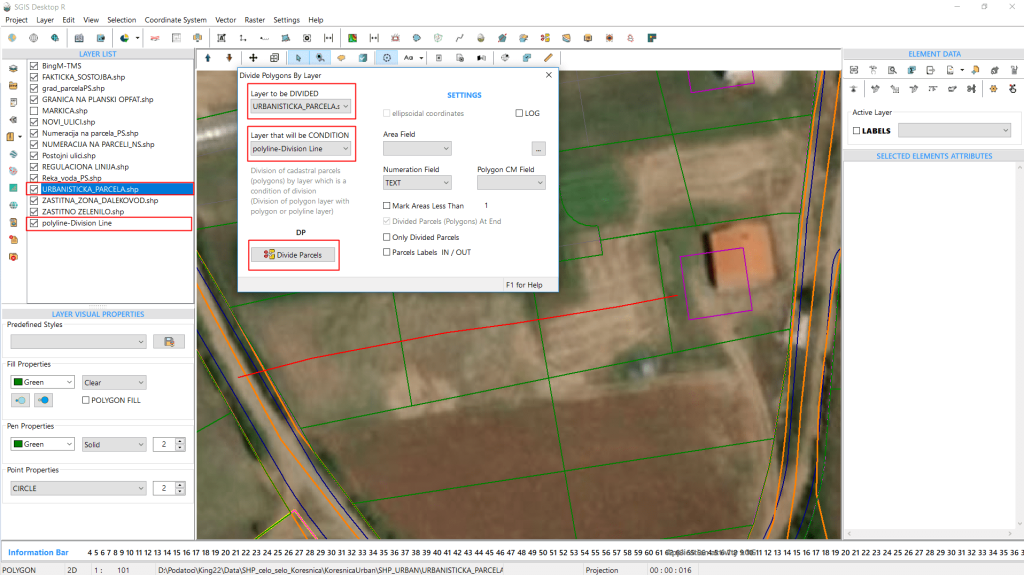
Fig. 35 To complete the division of multiple features, open the ‘Divide Parcels’ function. The dialog window will prompt you to select both the layer to be divided and the condition layer before proceeding.
The division is immediately visible, and a new temporary layer is automatically created in the list of layers.
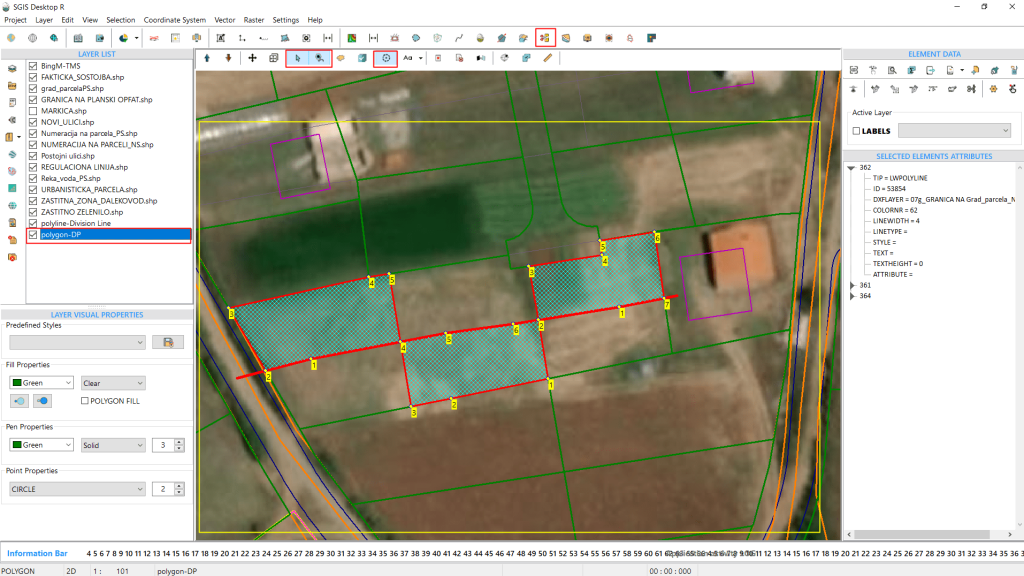
Fig. 36 The division process is complete.